

gfx
Pixel drawing under the text of the screen: shapes, text, sprites and scrolling.
The gfx library draws pixels on the computer's screen: points, lines, rectangles, circles, triangles, text in a small pixel font, sprites made of hex digits, and a scroll that slides the whole picture. It is how you build gauges, charts, maps of a rail network, control panels with real buttons, and games.
The drawing lies under the text of the screen. What you print stays readable on top of it, so a program can draw a picture and still use print, term.write and read as usual.
local s = gfx.size()
gfx.clear("light_blue")                              -- the sky
gfx.circle(262, 34, 16, "yellow", true)              -- the sun
gfx.rect(1, 128, s.w, s.h - 127, "green", true)      -- the grass
gfx.rect(104, 30, 12, 30, "gray", true)              -- a chimney
gfx.rect(36, 72, 96, 56, "brown", true)              -- the workshop
gfx.triangle(28, 72, 84, 38, 140, 72, "red", true)   -- its roof
gfx.rect(72, 98, 24, 30, "black", true)              -- the door
for i = 0, 7 do
  local a = i * math.pi / 4
  gfx.pixel(206 + math.cos(a) * 30, 96 + math.sin(a) * 30, "orange", 9)
end
gfx.circle(206, 96, 28, "orange", true)              -- a cogwheel
gfx.circle(206, 96, 9, "light_gray", true)
gfx.text(8, 8, "BRASS WORKS", "white", 2)
term.set_cursor(2, 18)
term.write("Text from term.write stays on top")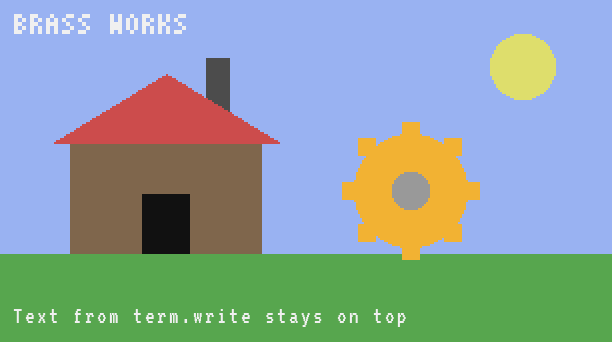
gfx.size() | The size of the drawing in pixels: the size of the text grid times 6 by 9. |
gfx.clear([color]) | Erases the drawing, or fills all of it with one colour. |
gfx.get_pixel(x, y) | The colour of one pixel of the drawing, as a number, even when it was drawn with a name. It is nil where nothing is drawn, outside the screen, and everywhere before the first drawing. |
gfx.pixel(x, y, color [, size]) | Colours one pixel, or a square of size × size pixels centred on it. |
gfx.line(x1, y1, x2, y2, color [, thickness]) | A straight line from (x1, y1) to (x2, y2), both ends included. |
gfx.rect(x, y, w, h, color [, fill]) | A rectangle w pixels wide and h pixels tall, its top left corner at (x, y). |
gfx.circle(x, y, radius, color [, fill]) | A circle around (x, y), or a disc, or a ring. |
gfx.triangle(x1, y1, x2, y2, x3, y3, color [, fill]) | A triangle through three corners, given in any order. |
gfx.fill(x, y, color) | The paint bucket: repaints the whole area of the same colour as the pixel at (x, y). |
gfx.text(x, y, text, color [, scale]) | Writes text with a tiny 3 × 5 pixel font, at any pixel and in any size. Returns the width it took. |
gfx.image(x, y, rows [, scale [, flip]]) | Draws a sprite: a small picture written as text, one character per pixel. |
gfx.scroll(dx, dy [, x, y, w, h]) | Slides the drawing by (dx, dy). What leaves the area is lost, and what comes in on the other side is empty. |
The pixel layer
Every character cell of the screen is 6 pixels wide and 9 pixels tall, so the size of the drawing follows the size of the text grid:
| Computer | Text | Pixels | Colours |
|---|---|---|---|
| Tube Computer | 40 × 14 | no gfx | paper teletype |
| Transistor Mainframe | 51 × 19 | 306 × 171 | green phosphor |
| Minicomputer | 51 × 19 | 306 × 171 | amber phosphor |
| Personal Computer | 51 × 19 | 306 × 171 | 16 colours |
| Microcontroller | 40 × 12 | 240 × 108 | 16 colours |
| Modern Computer | 64 × 24 | 384 × 216 | 16 colours |
The Tube Computer prints on paper and has no drawing: there, gfx is nil. A program meant to run everywhere can test if gfx then ... end.
Coordinates
Like term.set_cursor, coordinates start at (1, 1) in the top left corner. x grows to the right, y grows downwards. Decimal coordinates are rounded down, so you can pass the result of math.sin or a division directly.
Nothing is ever out of range: whatever falls outside the screen is simply cut off (clipped). A circle half off the edge draws its visible half, and a pixel at (-5, 400) draws nothing, without an error.
Colours
A colour is a name ("red"), or a number from 0 to 15 (term.colors.red, which is 14). The special name "none" (or the number -1) erases: the pixel becomes empty again and shows what is under the drawing. The 16 names and their numbers are in Colours. A number must be whole, from -1 to 15: anything else stops the program with bad argument #3 to 'pixel' (colour (0..15 or a name) expected, got number).
A name that does not exist stops the program, and the error lists the right ones:
gfx.rect(10, 10, 40, 20, "grey", true)snippet:1: bad argument #5 to 'rect' (unknown colou r 'grey': white, orange, magenta, light_blue, yello w, lime, pink, gray, light_gray, cyan, purple, blue , brown, green, red, black, none)
Layers: background, drawing, text
The screen is drawn in three layers, from bottom to top:
- the background colour of each character cell (
term.set_bgthenterm.clear, orwrite); - the drawing of
gfx; - the characters of the text.
So text always shows over the drawing, but the background colour of a character cell is hidden wherever something is drawn. Empty pixels let the cell backgrounds show through.
The drawing stays on the screen after the program ends. term.clear only clears the text: to remove the drawing, call gfx.clear(). The shell command clear, stopping a program with Ctrl+T and a reboot clear both.
Cost
Drawing is not free. Every call that changes pixels charges the program one instruction per 64 pixels touched, on top of the call itself. A Personal Computer runs 1,200 instructions per tick at full speed, and filling its whole screen (306 × 171 = 52,326 pixels) costs 817 of them. Text costs one instruction per character, times the scale squared; a sprite one per row, plus its pixels.
| Call | Instructions |
|---|---|
gfx.pixel, gfx.line, gfx.rect, gfx.circle, gfx.triangle, gfx.fill, gfx.scroll, gfx.clear(color) | 1 per 64 pixels |
gfx.text | number of characters × scale² |
gfx.image | 1 per row + 1 per 64 pixels |
gfx.clear(), gfx.size, gfx.get_pixel | nothing more than the call |
The screen is sent to the players who look at it at most every 2 ticks (a server setting), and only the band of pixel rows that changed since the last update travels over the network: from the highest change to the lowest. A small animated gauge costs almost nothing; redrawing the whole screen every tick sends the whole picture every time. Draw only what changes (see the patterns at the end of this page).
Monochrome screens
The Transistor Mainframe (green) and the Minicomputer (amber) have a single phosphor colour. On them, every colour except black lights up in the phosphor colour, and black is the dark screen. A drawing meant for them uses black for "off" and any other colour for "on". (An LCD Monitor attached to them shows the real colours: see Screens and monitors.)
local names = {"white", "orange", "magenta", "light_blue", "yellow", "lime", "pink", "gray",
  "light_gray", "cyan", "purple", "blue", "brown", "green", "red", "black"}
gfx.clear("black")
gfx.text(8, 8, "THE 16 COLOURS", "white", 2)
for i = 1, 16 do
  local x = 8 + (i - 1) * 18
  gfx.rect(x, 40, 16, 80, names[i], true)
  gfx.text(x + 2, 126, tostring(i - 1), "white")
end
gfx.rect(277, 39, 18, 82, "white")   -- a frame around the black one
gfx.text(8, 150, "BLACK (15) IS THE ONLY DARK ONE", "white")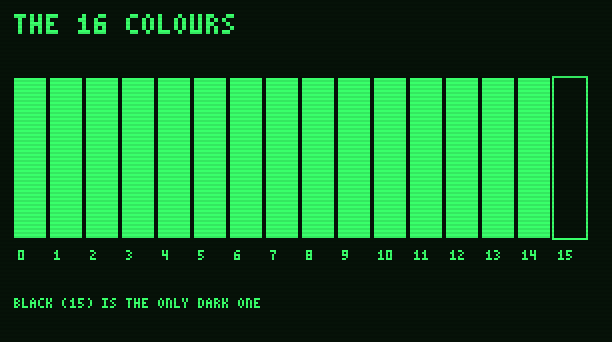
The same program on a Personal Computer:
local names = {"white", "orange", "magenta", "light_blue", "yellow", "lime", "pink", "gray",
  "light_gray", "cyan", "purple", "blue", "brown", "green", "red", "black"}
gfx.clear("black")
gfx.text(8, 8, "THE 16 COLOURS", "white", 2)
for i = 1, 16 do
  local x = 8 + (i - 1) * 18
  gfx.rect(x, 40, 16, 80, names[i], true)
  gfx.text(x + 2, 126, tostring(i - 1), "white")
end
gfx.rect(277, 39, 18, 82, "white")   -- a frame around the black one
gfx.text(8, 150, "BLACK (15) IS THE ONLY DARK ONE", "white")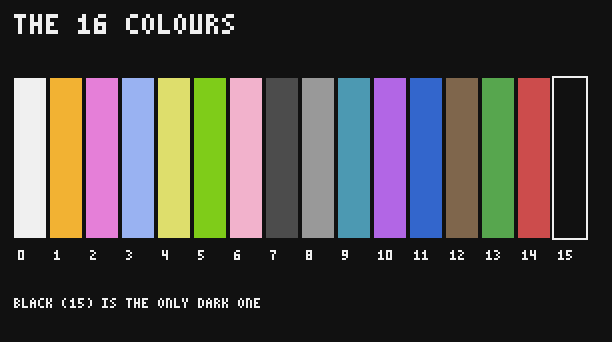
The size of the drawing in pixels: the size of the text grid times 6 by 9.
- table
{w = width, h = height}in pixels
local s = gfx.size()
print(s.w, s.h)
local t = term.get_size()
print(t.w * 6, t.h * 9)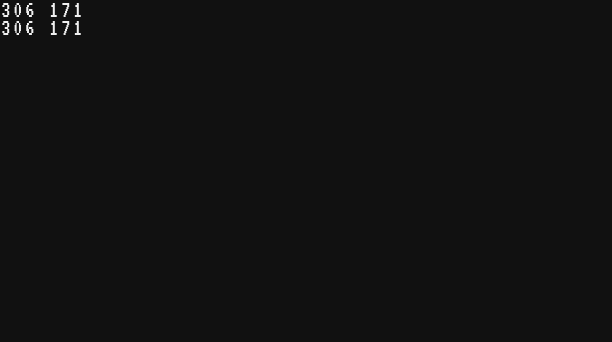
Use it instead of fixed numbers, and the same program fits every screen. This frame follows the edges of the screen whatever the computer:
local s = gfx.size()
gfx.clear("black")
gfx.line(1, 1, s.w, s.h, "gray")
gfx.line(s.w, 1, 1, s.h, "gray")
gfx.rect(1, 1, s.w, s.h, "yellow", 2)
gfx.text(5, 5, "1,1", "white")
local corner = s.w .. "," .. s.h
gfx.text(s.w - #corner * 4 - 3, s.h - 9, corner, "white")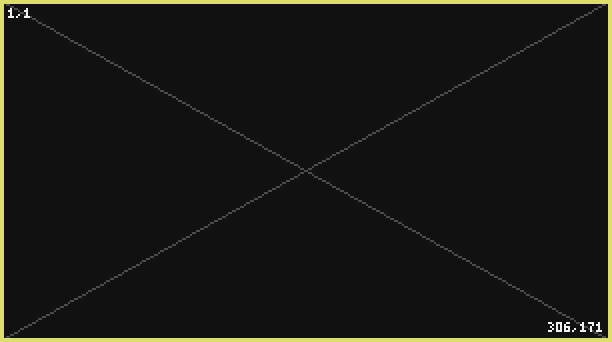
The same code on a Microcontroller, whose screen is 240 × 108:
local s = gfx.size()
gfx.clear("black")
gfx.line(1, 1, s.w, s.h, "gray")
gfx.line(s.w, 1, 1, s.h, "gray")
gfx.rect(1, 1, s.w, s.h, "yellow", 2)
gfx.text(5, 5, "1,1", "white")
local corner = s.w .. "," .. s.h
gfx.text(s.w - #corner * 4 - 3, s.h - 9, corner, "white")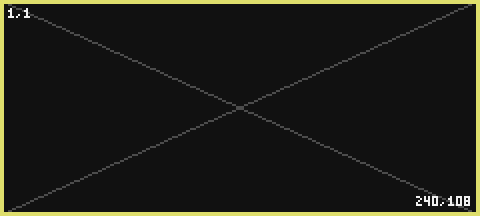
See also term.get_size()
Erases the drawing, or fills all of it with one colour.
colorstring|number optional- a colour that fills the whole picture; left out (or
"none"), the drawing is erased
Without a colour, every pixel becomes empty and the cell backgrounds of the text show again. This costs nothing. With a colour, the whole picture is painted, which costs one instruction per 64 pixels (817 on a Personal Computer).
gfx.clear does not touch the text, and term.clear does not touch the drawing. Here the cells are made gray with term.set_bg, the drawing covers them in blue, and a rectangle of "none" opens a window where the gray shows again:
term.set_bg(term.colors.gray)
term.clear()                                -- the text grid: gray cells
gfx.clear("blue")                           -- the drawing covers them
gfx.rect(84, 50, 144, 72, "none", true)     -- erased pixels: the gray shows again
term.set_cursor(16, 9)
term.write("a hole in the drawing")
term.set_cursor(2, 2)
term.write("The text is always on top")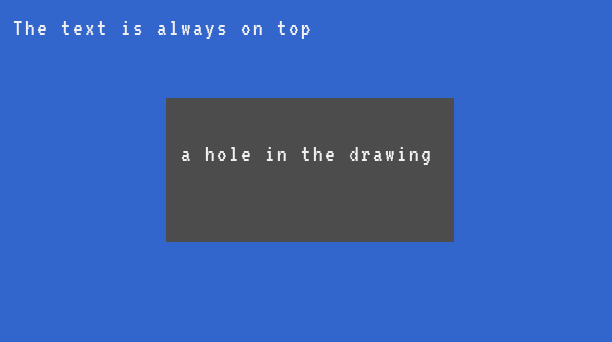
A program that redraws its screen from scratch usually starts with both:
term.set_bg(term.colors.black)
term.clear()
gfx.clear()
See also term.clear()
The colour of one pixel of the drawing, as a number, even when it was drawn with a name. It is nil where nothing is drawn, outside the screen, and everywhere before the first drawing.
xnumber- column of the pixel, from 1
ynumber- row of the pixel, from 1
- number|nil
- the colour number (0 to 15), or
nilwhere nothing is drawn
gfx.rect(10, 10, 20, 20, "red", true)
print(gfx.get_pixel(15, 15))
print(gfx.get_pixel(15, 15) == term.colors.red)
print(gfx.get_pixel(100, 100))14 true nil
Compare with a number: gfx.get_pixel(x, y) == "red" is always false. Use term.colors.red or 14.
It only reads the drawing, never the text. It is handy in small games, to know what a moving piece is about to hit: a wall drawn in gray, a coin drawn in yellow.
Points and lines
Colours one pixel, or a square of size × size pixels centred on it.
xnumber- column, from 1
ynumber- row, from 1
colorstring|number- a colour name or number,
"none"to erase sizenumber optional- the side of a square centred on (x, y), 1 to 64 (1 when left out)
With an odd size, (x, y) is exactly in the middle. With an even size, the extra row and column go to the right and to the bottom. Sizes above 64 are taken as 64. The red dots below mark the point given:
gfx.clear("black")
local sizes = {1, 2, 3, 5, 9, 15, 25}
local x = 16
for i = 1, #sizes do
  gfx.pixel(x, 60, "yellow", sizes[i])
  gfx.pixel(x, 60, "red")
  gfx.text(x - 2, 90, tostring(sizes[i]), "white")
  x = x + 22 + sizes[i]
end
gfx.text(8, 8, "GFX.PIXEL(X, Y, COLOR, SIZE)", "white", 2)
gfx.text(8, 130, "THE RED DOT IS THE POINT (X, Y)", "red")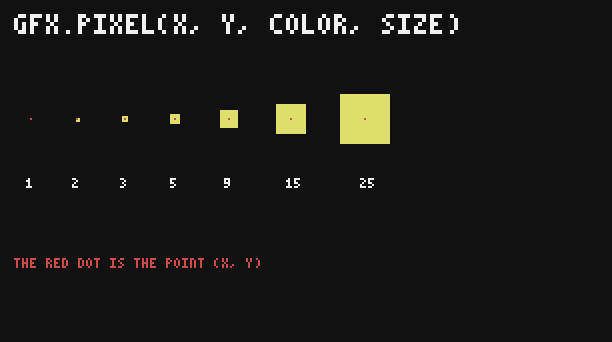
Points are the right tool for plots: one reading, one dot. Here a day of a solar-like curve, one dot every 4 pixels:
local s = gfx.size()
gfx.clear("black")
gfx.line(1, 150, s.w, 150, "gray")
for x = 1, s.w, 4 do
  local y = 150 - math.max(0, math.sin((x - 20) / 270 * math.pi)) * 120
  gfx.pixel(x, y, "yellow", 3)
end
gfx.text(4, 158, "6:00", "white")
gfx.text(s.w - 22, 158, "18:00", "white")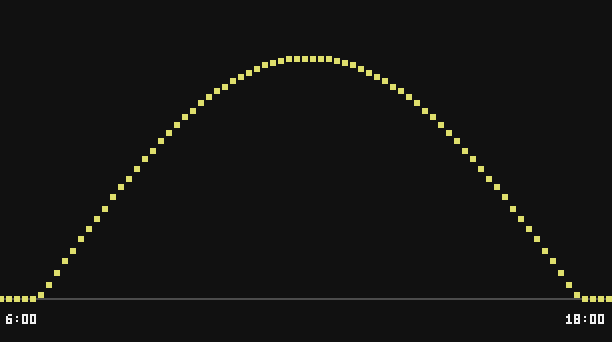
See also gfx.rect() gfx.get_pixel()
A straight line from (x1, y1) to (x2, y2), both ends included.
x1number- column of the start
y1number- row of the start
x2number- column of the end
y2number- row of the end
colorstring|number- a colour name or number,
"none"to erase thicknessnumber optional- 1 to 64 pixels (1 when left out)
A thin line is one pixel wide and has no gaps, even when it climbs steeply. A thick line stamps a square of thickness pixels at every point, so its ends are square, and it costs more: a 100-pixel line 8 pixels thick touches 6,400 pixels.
gfx.clear("black")
for i = 1, 4 do
  local t = 2 ^ (i - 1)
  local y = 10 + i * 30
  gfx.line(16, y + 12, 136, y - 8, "orange", t)
  gfx.text(146, y, "THICKNESS " .. t, "white")
end
for degrees = 0, 330, 30 do
  local a = degrees * math.pi / 180
  gfx.line(254, 86, 254 + math.cos(a) * 44, 86 + math.sin(a) * 44, "yellow")
end
gfx.circle(254, 86, 10, "yellow", true)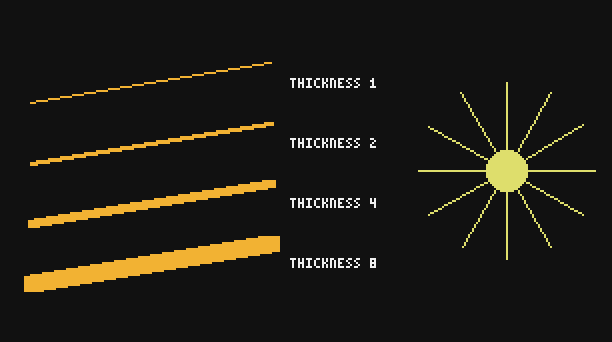
Lines between the readings of a sensor make a chart. Each segment joins one value to the next:
local levels = {40, 52, 47, 70, 95, 88, 120, 112, 90, 64, 58, 75}
gfx.clear("black")
gfx.rect(10, 10, 286, 150, "gray")
for i = 1, #levels - 1 do
  local x1 = 12 + (i - 1) * 25
  local x2 = 12 + i * 25
  gfx.line(x1, 158 - levels[i], x2, 158 - levels[i + 1], "lime", 2)
end
gfx.text(16, 16, "TANK LEVEL, LAST 12 HOURS", "white")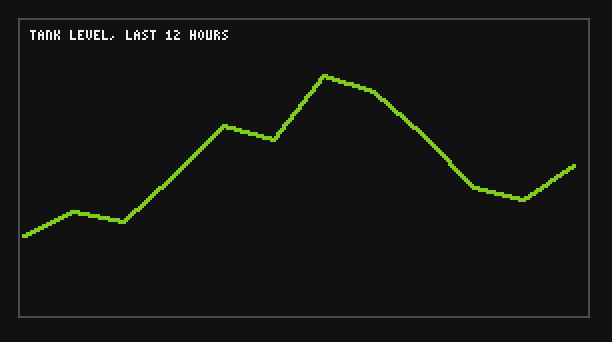
See also gfx.pixel() gfx.triangle()
Shapes
The shapes take their size and colour, then an optional last argument that says how to draw them: left out, an outline one pixel wide; true, filled; for rectangles and circles, a number gives the thickness of the border.
A rectangle w pixels wide and h pixels tall, its top left corner at (x, y).
xnumber- column of the top left corner
ynumber- row of the top left corner
wnumber- width in pixels
hnumber- height in pixels
colorstring|number- a colour name or number,
"none"to erase fillboolean|number optionaltrueto fill it, or the thickness of the border (1 to 64); an outline 1 pixel wide when left out
The border is drawn inside the rectangle: gfx.rect(10, 10, 50, 20, "red", 3) stays within the same 50 × 20 pixels as the filled rectangle, with a hole in the middle. When the border is at least half of the smaller side, the rectangle is simply filled. A width or a height of zero or less draws nothing.
gfx.clear("black")
gfx.rect(10, 20, 86, 50, "white")
gfx.rect(110, 20, 86, 50, "lime", true)
gfx.rect(210, 20, 86, 50, "orange", 6)
gfx.text(10, 76, "OUTLINE", "white")
gfx.text(110, 76, "TRUE: FILLED", "white")
gfx.text(210, 76, "6: BORDER", "white")
-- a progress bar: a frame, then the filled part
local done = 0.7
gfx.rect(10, 110, 200, 22, "white")
gfx.rect(12, 112, math.floor(196 * done), 18, "green", true)
gfx.text(220, 116, math.round(done * 100) .. "% CRUSHED", "white")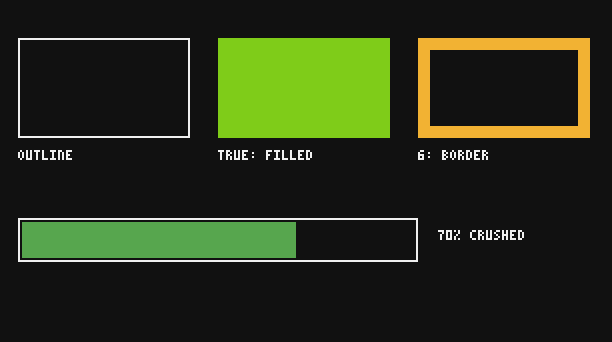
Filled rectangles are also the fastest way to erase part of the picture before drawing it again: paint it with the background colour, or with "none".
See also gfx.pixel() gfx.clear()
A circle around (x, y), or a disc, or a ring.
xnumber- column of the centre
ynumber- row of the centre
radiusnumber- in pixels; 0 draws a single pixel
colorstring|number- a colour name or number,
"none"to erase fillboolean|number optionaltruefor a disc, or the thickness of the ring (1 to 64); an outline 1 pixel wide when left out
The circle is 2 × radius + 1 pixels across. A border thickness grows inwards, like the border of a rectangle. A negative radius draws nothing.
gfx.clear("black")
gfx.circle(40, 50, 28, "white")
gfx.circle(40, 120, 28, "light_blue", true)
gfx.circle(110, 85, 34, "orange", 6)
gfx.text(14, 160, "OUTLINE, DISC, RING", "white")
-- a Create cogwheel: teeth first, then the wheel over them
local cx, cy = 226, 85
for i = 0, 11 do
  local a = i * math.pi / 6
  gfx.pixel(cx + math.cos(a) * 52, cy + math.sin(a) * 52, "brown", 13)
end
gfx.circle(cx, cy, 50, "brown", true)
gfx.circle(cx, cy, 40, "orange", 3)
gfx.circle(cx, cy, 14, "light_gray", true)
gfx.circle(cx, cy, 5, "black", true)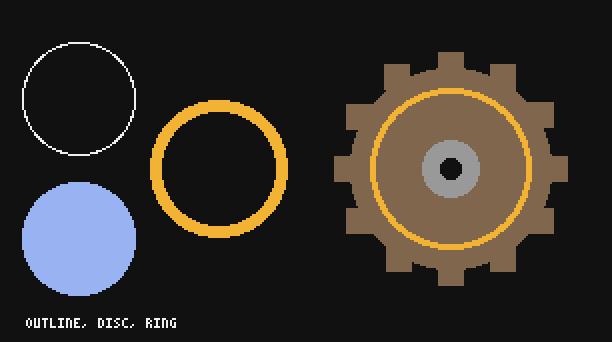
With math.cos and math.sin, circles become lamps, dials and radar screens. A ring of 8 status lamps, lit by a bit pattern:
local lit = {true, true, false, true, false, false, true, true}
gfx.clear("black")
for i = 1, 8 do
  local a = (i - 1) * math.pi / 4 - math.pi / 2
  local x = 153 + math.cos(a) * 60
  local y = 86 + math.sin(a) * 60
  local color = "gray"
  if lit[i] then color = "lime" end
  gfx.circle(x, y, 12, color, true)
  gfx.circle(x, y, 12, "white")
  gfx.text(x - 1, y - 2, tostring(i), "black")
end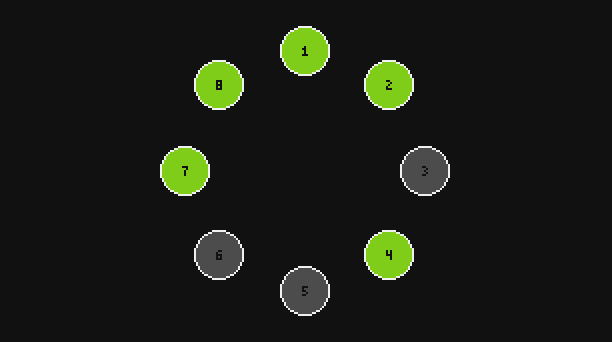
See also gfx.rect() math.cos()
A triangle through three corners, given in any order.
x1number- column of the first corner
y1number- row of the first corner
x2number- column of the second corner
y2number- row of the second corner
x3number- column of the third corner
y3number- row of the third corner
colorstring|number- a colour name or number,
"none"to erase fillboolean optionaltrueto fill it; an outline 1 pixel wide otherwise
Unlike rectangles and circles, a triangle has no border thickness: the last argument is true for a filled triangle, anything else draws the outline. For a thick outline, draw three lines with a thickness.
Triangles make roofs, mountains, and above all arrows:
gfx.clear("black")
gfx.triangle(20, 80, 60, 16, 100, 80, "green", true)
gfx.triangle(120, 80, 160, 16, 200, 80, "white")
gfx.text(20, 88, "FILLED", "white")
gfx.text(120, 88, "OUTLINE", "white")
-- trend arrows next to two stocks
gfx.triangle(20, 140, 30, 124, 40, 140, "lime", true)
gfx.text(48, 130, "IRON  +120/H", "lime")
gfx.triangle(150, 124, 160, 140, 170, 124, "red", true)
gfx.text(178, 130, "COAL  -45/H", "red")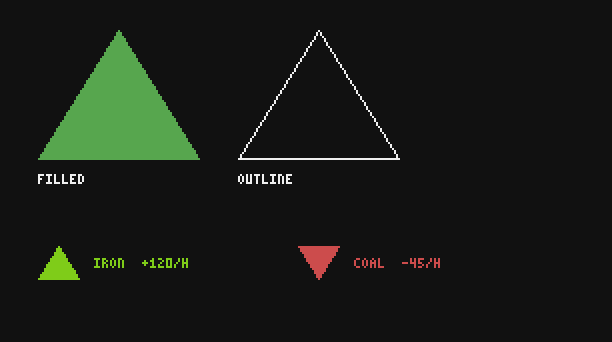
See also gfx.line()
The paint bucket: repaints the whole area of the same colour as the pixel at (x, y).
xnumber- column of the starting pixel
ynumber- row of the starting pixel
colorstring|number- the new colour, or
"none"to erase the area
The area spreads from (x, y) to the neighbours above, below, left and right that have exactly the same colour as the starting pixel. It stops at any other colour. Outlines drawn by gfx.line, gfx.circle and gfx.triangle are closed for it, even where they go diagonally, so the inside of a shape fills without leaking.
Empty pixels count as a colour of their own: on a picture cleared with gfx.clear("black"), a hole erased with "none" is a wall for a fill that starts on black.
Nothing happens when the pixel already has the new colour, or when (x, y) is outside the screen. The fill stops after 1,048,576 pixels, far more than the largest screen (82,944 pixels on a Modern Computer), so in practice it always fills the whole area, at one instruction per 64 pixels.
A closed shape fills on the inside only. Open a gap of one pixel and the paint escapes:
gfx.clear("black")
gfx.rect(4, 20, 146, 120, "gray")
gfx.rect(156, 20, 146, 120, "gray")
gfx.circle(77, 80, 40, "white")
gfx.circle(229, 80, 40, "white")
gfx.rect(266, 76, 6, 9, "black", true)     -- a gap in the right circle
gfx.fill(77, 80, "orange")
gfx.fill(229, 80, "orange")
gfx.text(30, 148, "CLOSED", "white")
gfx.text(170, 148, "ONE GAP: IT LEAKS", "white")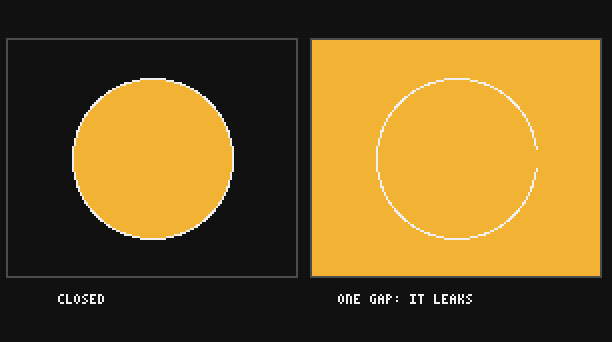
The shapes example of the computer uses it for clicks: each click paints the area under the mouse (see shapes).
See also gfx.get_pixel()
Text and sprites
Writes text with a tiny 3 × 5 pixel font, at any pixel and in any size. Returns the width it took.
xnumber- column of the left edge of the first letter
ynumber- row of the top of the letters
textstring- the text (a number is turned into text)
colorstring|number- a colour name or number,
"none"to erase scalenumber optional- 1 to 64, the size of each dot of the font (1 when left out)
- number
- the width of the text drawn, in pixels
Each letter is 3 dots wide and 5 tall, with one empty column after it: 4 pixels per character, so a line of 76 characters fits a Personal Computer at scale 1. At scale 2, every dot becomes 2 × 2 pixels, and so on.
The font has capital letters only (lowercase is drawn in capitals), digits, and these signs: space . , : ; ! ? ' " - + = / ( ) < > % * _ # [ ]. Accents are removed (É is drawn E), and every other character becomes ?.
gfx.clear("black")
gfx.text(4, 4, "ABCDEFGHIJKLMNOPQRSTUVWXYZ 0123456789", "white")
gfx.text(4, 12, ".,:;!?'\"-+=/()<>%*_#[]", "white")
gfx.text(4, 22, "lowercase is drawn in capitals", "yellow")
gfx.text(4, 30, "Déjà vu: accents are removed", "yellow")
gfx.text(4, 38, "No glyph: @ & $ { } ~", "red")
gfx.text(4, 54, "SCALE 2", "lime", 2)
gfx.text(4, 72, "SCALE 3", "lime", 3)
gfx.text(4, 98, "SCALE 6", "orange", 6)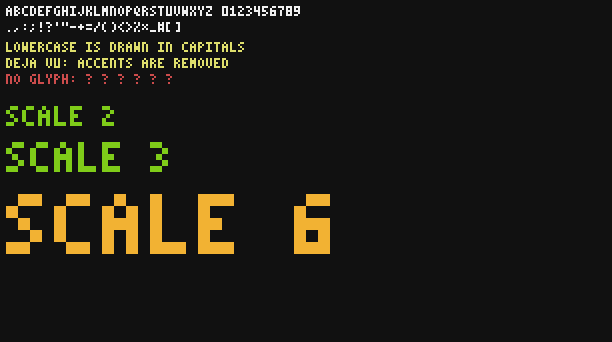
The width returned is (4 × characters - 1) × scale: the last empty column is not counted.
print(gfx.text(1, 1, "HELLO", "white"))
print(gfx.text(1, 10, "HELLO", "white", 2))
print(gfx.text(1, 30, "", "white"))19 38 0
Since the width is known in advance, centring is a subtraction. Keep such a helper at the top of your programs:
local s = gfx.size()
local function centered(y, text, color, scale)
  local width = (#text * 4 - 1) * scale
  gfx.text((s.w - width) // 2 + 1, y, text, color, scale)
end
gfx.clear("blue")
gfx.rect(1, 1, s.w, 30, "black", true)
centered(9, "STATION NORTH", "yellow", 3)
centered(60, "NEXT TRAIN", "white", 2)
centered(84, "2 MIN", "lime", 5)
centered(140, "PLATFORM 3, TO THE MINE", "white", 1)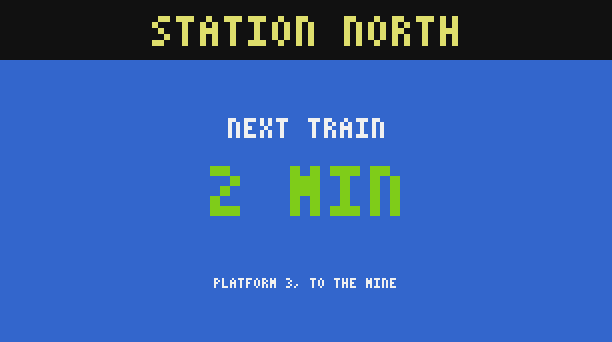
The returned width also places the next piece of text, for a label followed by a value in another colour:
local status = {
  {"PRESSURE", "OK", "lime"},
  {"BOILER", "HEATING", "yellow"},
  {"STRESS", "OVERLOAD", "red"},
}
gfx.clear("black")
for i, row in ipairs(status) do
  local y = 12 + (i - 1) * 24
  local x = 10 + gfx.text(10, y, row[1], "white", 2)
  gfx.text(x + 8, y, row[2], row[3], 2)
end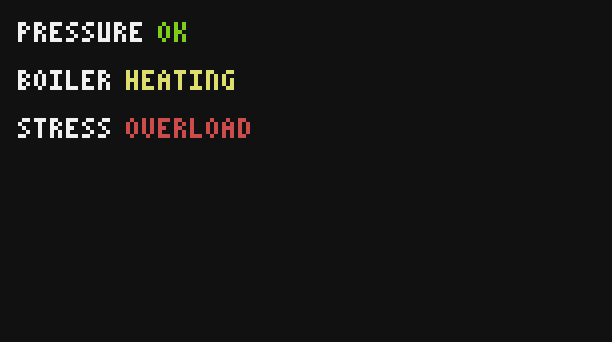
Text drawn with gfx.text is part of the drawing: it lies under the characters of print, it can be erased with "none" and it moves with gfx.scroll. Each character costs instructions (scale² each), so a big title drawn once is cheap, but redrawing a whole page of scale-3 text every tick is not.
See also gfx.image() term.write()
Draws a sprite: a small picture written as text, one character per pixel.
xnumber- column of the top left corner
ynumber- row of the top left corner
rowstable- a list of strings, one per row of pixels, one hex digit per pixel
scalenumber optional- 1 to 64, each pixel of the sprite becomes a square of this size (1 when left out)
flipboolean optionaltruemirrors the sprite left to right
Each row is a string. Each character is a hex digit, the number of a colour: 0 white, 1 orange... 9 cyan, a purple, b blue, c brown, d green, e red, f black (capitals work too). Any other character, such as . or a space, is transparent: the pixel keeps what was there before. The full table is in Colours.
gfx.clear("light_blue")
gfx.rect(1, 110, 306, 62, "green", true)
local creeper = {
  "5d5dd5d5",
  "d5ddd5dd",
  "dffd5ffd",
  "5ffddff5",
  "dd5ffd5d",
  "d5ffffdd",
  "5dffffd5",
  "ddfd5fdd",
}
gfx.image(10, 10, creeper)
gfx.image(30, 10, creeper, 4)
gfx.image(76, 10, creeper, 8)
gfx.text(10, 84, "SCALE 1, 4 AND 8", "black")
local arrow = {
  "....4....",
  "....44...",
  "44444444.",
  "444444444",
  "44444444.",
  "....44...",
  "....4....",
}
gfx.image(170, 20, arrow, 4)
gfx.text(214, 32, "NORMAL", "black")
gfx.image(170, 96, arrow, 4, true)       -- mirrored, half over the grass
gfx.text(214, 108, "FLIP", "black")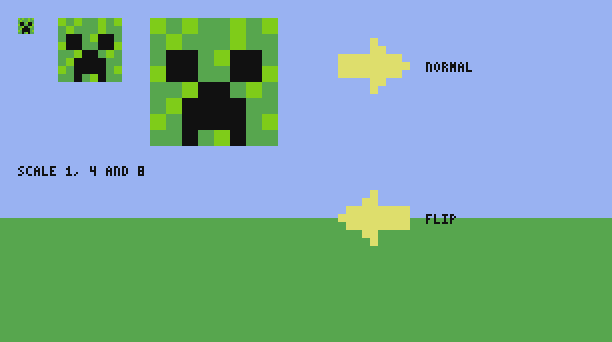
scale makes each pixel a square, and flip mirrors the sprite, so a character walking left and right needs only one picture. Each row is mirrored on its own length: give every row the same length (pad with .), or a mirrored sprite falls apart.
A row that is not a string stops the program: bad argument #3 to 'image' (row 2 is not a string). There is no digit for "erase": to remove a sprite, draw a rectangle of the background colour (or of "none") over it.
See also gfx.text() Colours
Scrolling
Slides the drawing by (dx, dy). What leaves the area is lost, and what comes in on the other side is empty.
dxnumber- pixels to the right (negative: to the left)
dynumber- pixels down (negative: up); 0 when left out
xnumber optional- column of the top left corner of the area to move
ynumber optional- row of the top left corner of the area
wnumber optional- width of the area
hnumber optional- height of the area
With four more numbers, only that rectangle moves and the rest of the picture stays still: a status bar can stay on top while the landscape below scrolls. Give all four or none. The text of the screen does not move (that is term.scroll), and before any drawing it does nothing.
A scroll costs as much as filling its area once (one instruction per 64 pixels), whatever is drawn in it: a landscape made of hundreds of shapes moves for the price of one rectangle, and only the new strip at the edge needs drawing. This is how side-scrolling games and live charts work. Here the hills come in from the right, 2 pixels per tick, under a title bar that does not move:
local s = gfx.size()
local TOP = 20
gfx.clear("light_blue")
gfx.rect(1, 1, s.w, TOP - 1, "gray", true)
gfx.text(4, 7, "SCROLLING HILLS", "white")
local step = 0
while true do
  step = step + 1
  gfx.scroll(-2, 0, 1, TOP, s.w, s.h - TOP + 1)   -- everything under the bar, 2 pixels left
  local ground = 120 + math.floor(18 * math.sin(step / 9) + 7 * math.sin(step / 3.7))
  gfx.rect(s.w - 1, TOP, 2, ground - TOP, "light_blue", true)
  gfx.rect(s.w - 1, ground, 2, 4, "lime", true)
  gfx.rect(s.w - 1, ground + 4, 2, s.h - ground - 3, "brown", true)
  sleep(0.05)
end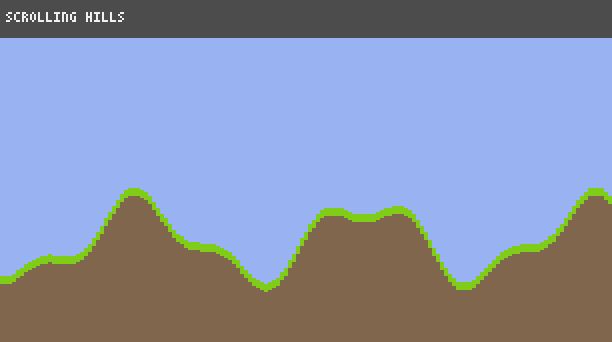
See also term.scroll()
Patterns
Complete small programs that combine the functions above. They use sample numbers so that they run anywhere: in your world, the values come from peripheral.wrap(), inventory.count(), kinetic.speed() and the other devices.
A bar chart
The stock of a warehouse, one bar per item, scaled so that the largest fills the chart:
local stock = {
  {name = "IRON", count = 1450, color = "light_gray"},
  {name = "COPPER", count = 820, color = "orange"},
  {name = "ZINC", count = 610, color = "light_blue"},
  {name = "BRASS", count = 1980, color = "yellow"},
  {name = "ANDESITE", count = 2400, color = "gray"},
}
local s = gfx.size()
local BASE = s.h - 20       -- the bottom of the bars
local TALLEST = 110
local most = 0
for _, item in ipairs(stock) do
  most = math.max(most, item.count)
end

local function centered(x, w, y, text, color)
  gfx.text(x + (w - (#text * 4 - 1)) // 2, y, text, color)
end

gfx.clear("black")
gfx.text(6, 6, "WAREHOUSE STOCK", "white", 2)
gfx.line(4, BASE + 1, s.w - 4, BASE + 1, "gray")
for i, item in ipairs(stock) do
  local x = 14 + (i - 1) * 58
  local h = math.max(1, math.floor(item.count / most * TALLEST))
  gfx.rect(x, BASE - h + 1, 40, h, item.color, true)
  centered(x, 40, BASE - h - 7, tostring(item.count), "white")
  centered(x, 40, BASE + 6, item.name, item.color)
end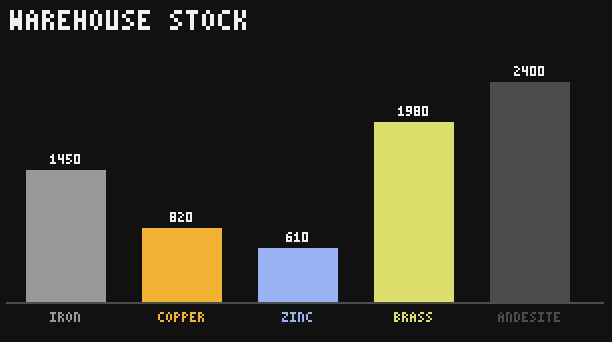
A gauge
A speedometer for a Create shaft: a half circle of coloured dots, ticks every 32 RPM, and a needle. The angle goes from π (left, 0 RPM) to 2π (right, 256 RPM). The sine of these angles is negative and y grows downwards on the screen, so the arc rises above its centre.
local CX, CY, R = 153, 124, 84
local rpm = 192
gfx.clear("black")
for degrees = 0, 180, 3 do
  local value = degrees / 180 * 256
  local color = "lime"
  if value > 224 then
    color = "red"
  elseif value > 160 then
    color = "yellow"
  end
  local a = math.pi + degrees * math.pi / 180
  gfx.pixel(CX + math.cos(a) * R, CY + math.sin(a) * R, color, 5)
end
for v = 0, 256, 32 do
  local a = math.pi + v / 256 * math.pi
  gfx.line(CX + math.cos(a) * (R - 16), CY + math.sin(a) * (R - 16),
    CX + math.cos(a) * (R - 8), CY + math.sin(a) * (R - 8), "white")
end
local a = math.pi + rpm / 256 * math.pi
gfx.line(CX, CY, CX + math.cos(a) * (R - 22), CY + math.sin(a) * (R - 22), "red", 3)
gfx.circle(CX, CY, 7, "light_gray", true)
local label = rpm .. " RPM"
gfx.text(CX - (#label * 4 - 1), CY + 18, label, "white", 2)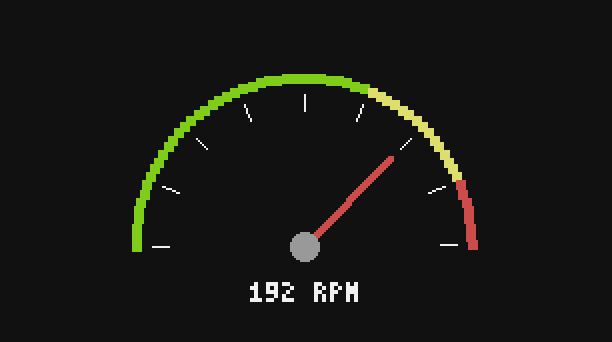
When the speed changes, there is no need to redraw the dial: draw the old needle again in black, then the new one.
Animate without flicker
The screen reaches the players every 2 ticks. If a frame takes longer than one tick of instructions to draw (a full clear and a redraw easily do), the program pauses in the middle of it and the players may see a half-drawn picture: the screen flickers. Two habits avoid it:
- Do not clear the whole screen for every frame. Erase only what moves (a rectangle of the background colour over its old place), then draw it at its new place.
- **Slide what is already drawn with
gfx.scroll**, then draw only the new part. The picture is never empty, and the frame costs a fraction of a redraw.
A live chart of the stress of a factory works like this: each tick, the chart moves 2 pixels left and a single new segment is drawn at the right edge.
local X, Y, W, H = 10, 30, 286, 120      -- the chart area
gfx.clear("black")
gfx.text(10, 10, "STRESS", "white", 2)
gfx.rect(X - 1, Y - 1, W + 2, H + 2, "gray")
local last = Y + H // 2
local t = 0
while true do
  t = t + 1
  -- a sample reading from 0 to 1; in a world: stress / capacity of a kinetic device
  local usage = 0.5 + 0.35 * math.sin(t / 8) + 0.1 * math.sin(t / 2.3)
  local y = Y + H - 1 - math.floor(usage * (H - 1))
  gfx.scroll(-2, 0, X, Y, W, H)
  local color = "lime"
  if usage > 0.8 then color = "red" end
  gfx.line(X + W - 3, last, X + W - 1, y, color)
  last = y
  sleep(0.05)
end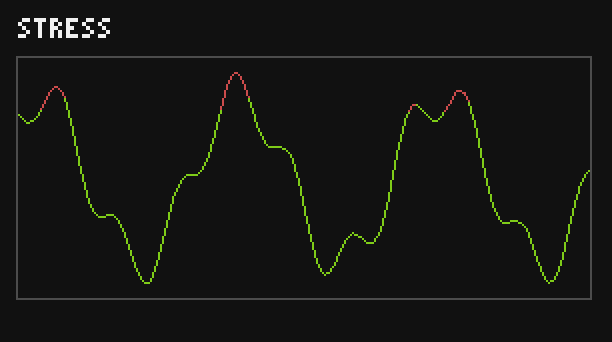
A sprite animation
A small locomotive drives along its rails. It has two pictures whose wheels differ, shown in turn, and it is mirrored when it turns back. Each step erases the old place with a rectangle of the sky colour, so the rest of the picture is never redrawn.
local FRAMES = {
  {
    ".........7777...",
    ".cccc.....77....",
    ".c33c.....77....",
    ".cccceeeeeeeeeee",
    "4cccceeeeeeeeeee",
    "4cccceeeeeeeeeee",
    "ffffffffffffffff",
    "..f.f..f.f..f.f.",
    "...8....8....8..",
    "..f.f..f.f..f.f.",
  },
  {
    ".........7777...",
    ".cccc.....77....",
    ".c33c.....77....",
    ".cccceeeeeeeeeee",
    "4cccceeeeeeeeeee",
    "4cccceeeeeeeeeee",
    "ffffffffffffffff",
    "...f....f....f..",
    "..f8f..f8f..f8f.",
    "...f....f....f..",
  },
}
local SCALE = 4
local Y = 80
local s = gfx.size()
gfx.clear("light_blue")
gfx.rect(1, Y + 40, s.w, 4, "gray", true)            -- the rails
gfx.rect(1, Y + 44, s.w, s.h - Y - 43, "green", true)
gfx.text(8, 8, "THE MINE SHUTTLE", "white", 2)
local x, dx, frame = 10, 4, 1
while true do
  gfx.rect(x, Y, 16 * SCALE, 10 * SCALE, "light_blue", true)   -- erase the old place
  x = x + dx
  if x + 16 * SCALE > s.w or x < 1 then
    dx = -dx                                           -- turn back
    x = x + 2 * dx
  end
  frame = 3 - frame                                    -- 1, 2, 1, 2...
  gfx.image(x, Y, FRAMES[frame], SCALE, dx < 0)        -- mirrored when going left
  sleep(0.1)
end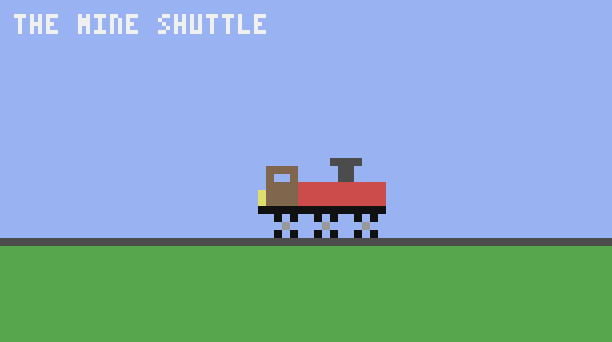
Buttons drawn in pixels
Buttons of any size, anywhere, with a label in the pixel font. A click event carries e.px and e.py, the pixel under the mouse (or under the finger, on a monitor): the button hit is the one whose rectangle contains that point. See Screens and monitors for clicks on monitors.
local buttons = {
  {x = 12, y = 44, w = 88, h = 64, label = "PRESS", color = "orange", side = "left", on = true},
  {x = 109, y = 44, w = 88, h = 64, label = "MIXER", color = "light_blue", side = "right", on = false},
  {x = 206, y = 44, w = 88, h = 64, label = "FAN", color = "red", side = "top", on = false},
}

local function draw(b)
  local fill, ink = "gray", "white"
  if b.on then
    fill, ink = b.color, "black"
  end
  gfx.rect(b.x, b.y, b.w, b.h, fill, true)
  gfx.rect(b.x, b.y, b.w, b.h, "white", 2)
  local width = (#b.label * 4 - 1) * 2
  gfx.text(b.x + (b.w - width) // 2, b.y + b.h // 2 - 4, b.label, ink, 2)
end

local function inside(b, px, py)
  return px >= b.x and px < b.x + b.w and py >= b.y and py < b.y + b.h
end

gfx.clear("black")
gfx.text(12, 12, "LINE 2 CONTROLS", "white", 2)
gfx.text(12, 130, "CLICK A BUTTON TO SWITCH ITS MACHINE", "light_gray")
for _, b in ipairs(buttons) do
  draw(b)
end
while true do
  local e = os.pull_event("click")
  for _, b in ipairs(buttons) do
    if inside(b, e.px, e.py) then
      b.on = not b.on
      rs.set(b.side, b.on)
      draw(b)               -- redraw only the button that changed
    end
  end
end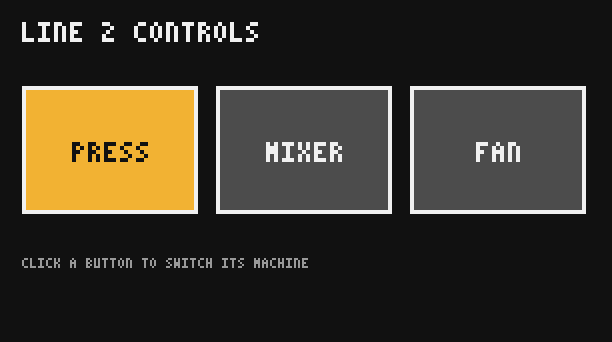
The test itself is plain arithmetic, so you can check it without clicking:
local press = {x = 12, y = 40, w = 88, h = 40}
local function inside(b, px, py)
  return px >= b.x and px < b.x + b.w and py >= b.y and py < b.y + b.h
end
print(inside(press, 50, 60))
print(inside(press, 100, 60))true false
px < b.x + b.w, with a strict <, because a button 88 pixels wide starting at 12 ends at pixel 99.