
 Data logger and graph
Record a value every minute in a CSV file that never grows too big, and draw the last hour as a line graph with axes.
A number on a screen tells you how things are; a curve tells you where they are going. Is the iron vault slowly emptying since you added the second press line? Does the stress jump every time the train unloads? This recipe records two values every minute (the stock of a vault and the stress of the kinetic network) into a file, and draws the last hour of each as a line graph.
You will see how to write a log with fs.append, how to keep it from filling the disk (rotation), how to read it back after a reboot, and how to turn a list of numbers into a graph with gfx.line.
What you need
- A Personal Computer (or a Modern Computer): colours for two curves, and a floppy disk (64 KB) for the log. The program records once a minute, so speed is no concern. On a Modern Computer the graphs get wider by themselves.
- A vault or a chest against the left side of the computer: the stock to follow.
- A kinetic block to read the stress. The simplest is the shaft that turns the computer: it is a kinetic peripheral on the
backside, and its network is the factory's when the computer is powered by the factory. To watch another network, put a Stressometer of that network against the computer and changeGAUGE. - Optionally, monitors against the computer to show the graphs in big.
Seen from above:

   [Vault]-[PC]==== factory shaft (the back of the computer)
             |
(monitors in front, optional)How it works
1. Settings
local CHEST = "left"                  -- the inventory to count
local ITEM = "minecraft:iron_ingot"   -- the item to count, or nil for everything
local GAUGE = "back"                  -- a kinetic block: the shaft of the computer will do
local PERIOD = 60                     -- seconds between two records
local LOG = "/logs/factory.csv"
local OLD = "/logs/factory.old.csv"
local MAX_BYTES = 8000                -- past this size, the log becomes the old one
local POINTS = 60                     -- values on the graphs: the last hour
The paths start with /: they are taken from the root of the disk whatever the current folder is when the program starts. fs.write creates the logs folder on the first record.
2. Reading the values
A record is a small table: the time, and the two values. A value that cannot be read (a broken chest, a missing gauge) stays nil: the record is still written, with an empty field, and the curve shows a gap there. Both readings go through pcall, so a block removed at the wrong moment never stops the logger.
local function read_values()
  local entry = {time = clock()}
  local chest = peripheral.wrap(CHEST)
  if chest then
    local r = pcall(chest.count, ITEM)
    if r.ok then entry.stock = r.value end
  end
  local gauge = peripheral.wrap(GAUGE)
  if gauge then
    local used = pcall(gauge.stress)
    local capacity = pcall(gauge.capacity)
    if used.ok and capacity.ok and capacity.value > 0 then
      entry.stress = math.round(used.value / capacity.value * 100)
    end
  end
  return entry
end
@inventory.count with an item id counts only that item, without one it counts everything. The stress is stored as a percentage of the capacity, easier to read than stress units.
The time is the world's clock, from os.day_time, turned into hh:mm: 0 is 6 in the morning, 1000 ticks are an hour. Keep in mind that a Minecraft day lasts 20 real minutes: one record per real minute means 1 h 12 of world time between two lines of the log, and the 60 records of the graphs cover three Minecraft days. The world's clock also has no day number. That is why the graphs count time backwards from the newest record ("-15M", "NOW") instead of printing clock times. For a count that keeps growing, use os.clock, the seconds since the computer started (it starts again from 0 at each reboot).
3. The CSV file and its rotation
The file is CSV ("comma-separated values"): a header line, then one line per record. Any program, or you with cat, can read it.
time,stock,stress
18:02,1462,58
19:14,1440,61
20:26,,61
fs.append adds a line at the end of the file, and creates it if needed. But a log that only grows ends up filling the disk: at one record a minute, about 20 KB for each real day. So before each record, rotate looks at the size of the log (fs.size, nil when the file does not exist yet). Past MAX_BYTES, the log is renamed into the old one with fs.move, after deleting the previous old one. Two files of 8 KB at most: about nine hours of records each, 16 KB on the disk forever.
local function rotate()
  local size = fs.size(LOG)
  if size and size > MAX_BYTES then
    fs.delete(OLD)
    fs.move(LOG, OLD)
  end
end

local function record(e)
  rotate()
  if not fs.exists(LOG) then fs.write(LOG, "time,stock,stress\n") end
  fs.append(LOG, e.time .. "," .. field(e.stock) .. "," .. field(e.stress) .. "\n")
end
field writes nil as an empty field rather than the word nil. When writing fails (not enough space, or no disk in the drive), the error is caught by the pcall around record: the screen shows CANNOT WRITE THE LOG, the old log is deleted to make room, and the logger keeps running.
4. The history in memory
The graphs need the last 60 records, not the whole file. remember keeps them in a list, oldest first, and drops the oldest once there are more than POINTS. At start, load_file reads the old log then the current one and passes each line to remember: after a reboot, the curves come back as they were.
local function load_file(path)
  local text = fs.read(path)
  if text == nil then return end
  for _, line in ipairs(string.split(text, "\n")) do
    local f = string.split(line, ",")
    if #f == 3 and f[1] ~= "time" then
      remember({time = f[1], stock = tonumber(f[2]), stress = tonumber(f[3])})
    end
  end
end
string.split keeps empty fields ("20:26,,61" gives three fields, the second one empty), and tonumber("") is nil: a gap in the file becomes a gap in the curve. The header line and the empty line after the last newline are skipped by the test.
5. Drawing a graph
draw_graph draws one graph in a band of the screen: its title and newest value, the axes, a dotted line in the middle, the scale, and the curve.
The scale comes from the values: the lowest and highest of the history. A graph can ask for a minimum range: the stress graph always shows 0 to 100 %, so a calm network does not look like it is going wild. When all values are equal, the range is widened by one to avoid a division by zero.
Each value then becomes a point. The newest one is always on the right edge, the others go left, one step per record:
local function x_of(i, n)
  return PLOT_X + (POINTS - n + i - 1) * (PLOT_W - 1) // (POINTS - 1)
end
and its height is its place between low and high, upside down since pixel rows grow downwards:
local y = py + ph - 1 - math.round((v - low) / (high - low) * (ph - 1))gfx.line joins each point to the previous one. A missing value sets prev back to nil, so the line stops there and starts again at the next value. The newest point gets a white dot, gfx.pixel with a size of 3.
Under the graphs, draw writes the time axis: a mark every 15 records, counted back from the newest one, "-15M" for 15 minutes ago. The positions do not depend on the clock, only on PERIOD: the axis assumes one record per period, so after a long stop of the computer the oldest points are older than the axis says.
6. The main loop
sample does one record: read, write, remember, draw. The loop waits for its timer with os.pull_event("timer"): this program has nothing else to wait for. Drawing once a minute, the whole graph is redrawn each time; that is a few hundred instructions, nothing for a Personal Computer.
The whole program
-- Data logger: every minute, writes the stock of a vault and the stress of the
-- kinetic network into a CSV file, and draws the last hour as two graphs.
-- Personal Computer, a vault (or chest) on its left, turned by the factory's shaft.

-- 1. Settings
local CHEST = "left"                  -- the inventory to count
local ITEM = "minecraft:iron_ingot"   -- the item to count, or nil for everything
local GAUGE = "back"                  -- a kinetic block: the shaft of the computer will do
local PERIOD = 60                     -- seconds between two records
local LOG = "/logs/factory.csv"
local OLD = "/logs/factory.old.csv"
local MAX_BYTES = 8000                -- past this size, the log becomes the old one
local POINTS = 60                     -- values on the graphs: the last hour

local GRAPHS = {
  {key = "stock", title = "IRON", color = "light_blue"},
  {key = "stress", title = "STRESS %", color = "orange", low = 0, high = 100},
}

local history = {}    -- the last POINTS records, oldest first
local problem = nil   -- shown at the bottom of the screen when the log cannot be written

local function clock()
  local t = (os.day_time() + 6000) % 24000
  return string.format("%02d:%02d", t // 1000, t % 1000 * 60 // 1000)
end

-- 2. Reading: a record is {time =, stock =, stress =}, nil where a block is missing
local function read_values()
  local entry = {time = clock()}
  local chest = peripheral.wrap(CHEST)
  if chest then
    local r = pcall(chest.count, ITEM)
    if r.ok then entry.stock = r.value end
  end
  local gauge = peripheral.wrap(GAUGE)
  if gauge then
    local used = pcall(gauge.stress)
    local capacity = pcall(gauge.capacity)
    if used.ok and capacity.ok and capacity.value > 0 then
      entry.stress = math.round(used.value / capacity.value * 100)
    end
  end
  return entry
end

-- 3. The file: a header, then one line per record, "18:30,1234,75"
local function field(v)
  if v == nil then return "" end
  return tostring(v)
end

-- A full log becomes the old one; the old one is deleted
local function rotate()
  local size = fs.size(LOG)
  if size and size > MAX_BYTES then
    fs.delete(OLD)
    fs.move(LOG, OLD)
  end
end

local function record(e)
  rotate()
  if not fs.exists(LOG) then fs.write(LOG, "time,stock,stress\n") end
  fs.append(LOG, e.time .. "," .. field(e.stock) .. "," .. field(e.stress) .. "\n")
end

-- The history in memory: the graphs only need the last POINTS records
local function remember(e)
  table.insert(history, e)
  if #history > POINTS then table.remove(history, 1) end
end

local function load_file(path)
  local text = fs.read(path)
  if text == nil then return end
  for _, line in ipairs(string.split(text, "\n")) do
    local f = string.split(line, ",")
    if #f == 3 and f[1] ~= "time" then
      remember({time = f[1], stock = tonumber(f[2]), stress = tonumber(f[3])})
    end
  end
end

-- 4. Drawing
local size = gfx.size()
local W, H = size.w, size.h
local PLOT_X = 26                     -- left edge of the plots, after the scale
local PLOT_W = W - PLOT_X - 6
local GRAPH_H = (H - 12) // #GRAPHS   -- a graph and its title; 12 px left for the times

local function short(n)
  if math.abs(n) >= 10000 then return math.round(n / 1000) .. "K" end
  return tostring(n)
end

-- x of the i-th of n values: the newest one is always on the right edge
local function x_of(i, n)
  return PLOT_X + (POINTS - n + i - 1) * (PLOT_W - 1) // (POINTS - 1)
end

local function draw_graph(g, top)
  local py, ph = top + 14, GRAPH_H - 18
  gfx.rect(1, top, W, GRAPH_H, "black", true)
  -- the range of the values, at least low..high when the graph has them
  local low, high, newest = math.huge, -math.huge, nil
  for _, e in ipairs(history) do
    local v = e[g.key]
    if v then
      low, high, newest = math.min(low, v), math.max(high, v), v
    end
  end
  if g.low then low, high = math.min(low, g.low), math.max(high, g.high) end
  gfx.text(4, top, g.title, "white", 2)
  if newest == nil then
    gfx.text(PLOT_X, py + ph // 2 - 2, "NO DATA YET", "gray")
    return
  end
  if high == low then high = low + 1 end
  local value = short(newest)
  gfx.text(W - 6 - #value * 8 + 2, top, value, g.color, 2)
  -- axes, a dotted middle line, the scale
  gfx.line(PLOT_X - 1, py, PLOT_X - 1, py + ph, "gray")
  gfx.line(PLOT_X - 1, py + ph, PLOT_X + PLOT_W, py + ph, "gray")
  for x = PLOT_X, PLOT_X + PLOT_W, 4 do gfx.pixel(x, py + ph // 2, "gray") end
  gfx.text(2, py, short(high), "light_gray")
  gfx.text(2, py + ph - 5, short(low), "light_gray")
  -- the curve: a line from each value to the next, broken where one is missing
  local px, prev = nil, nil
  for i, e in ipairs(history) do
    local v = e[g.key]
    if v then
      local x = x_of(i, #history)
      local y = py + ph - 1 - math.round((v - low) / (high - low) * (ph - 1))
      if prev then gfx.line(px, prev, x, y, g.color) end
      px, prev = x, y
    else
      prev = nil
    end
  end
  if prev then gfx.pixel(px, prev, "white", 3) end
end

-- "15M" for 900 seconds, "30S" for 30
local function ago(seconds)
  if seconds >= 60 then return (seconds // 60) .. "M" end
  return seconds .. "S"
end

local function draw()
  for i, g in ipairs(GRAPHS) do draw_graph(g, (i - 1) * GRAPH_H + 2) end
  -- the time axis: a mark every 15 records, counted back from the newest
  gfx.rect(1, H - 8, W, 8, "black", true)
  for k = 0, POINTS - 1, 15 do
    local label = "NOW"
    if k > 0 then label = "-" .. ago(k * PERIOD) end
    local x = x_of(POINTS - k, POINTS)
    gfx.text(math.min(x - #label * 2, W - #label * 4), H - 6, label, "gray")
  end
  if problem then
    gfx.rect(1, H - 8, W, 8, "black", true)
    gfx.text(W // 2 - #problem * 2, H - 6, problem, "red")
  end
end

-- 5. One record: read, write to the file, add to the graphs
local function sample()
  local e = read_values()
  local r = pcall(record, e)
  if r.ok then
    problem = nil
  else
    problem = "CANNOT WRITE THE LOG"
    pcall(fs.delete, OLD)   -- make room for the next try
  end
  remember(e)
  draw()
end

-- 6. Main loop: the history of the files, then one record per PERIOD
term.clear()
gfx.clear("black")
load_file(OLD)
load_file(LOG)
sample()
local timer = os.start_timer(PERIOD)
while true do
  local e = os.pull_event("timer")
  if e.id == timer then
    sample()
    timer = os.start_timer(PERIOD)
  end
endWhat it looks like
This demo keeps the drawing code of the program and fills the history with an hour made up for the occasion: a press line eats the iron, a second line started 40 minutes ago and loads the network, a train refilled the vault 25 minutes ago. One record is missing 15 minutes ago (the vault was being enlarged), and the curve breaks there.
local POINTS, PERIOD = 60, 60
local GRAPHS = {
  {key = "stock", title = "IRON", color = "light_blue"},
  {key = "stress", title = "STRESS %", color = "orange", low = 0, high = 100},
}
local problem = nil

-- an hour of sample records, oldest first
local history = {}
for i = 1, POINTS do
  local e = {stock = 1500 - i * 16 + math.round(30 * math.sin(i)), stress = 52 + math.round(4 * math.sin(i / 2))}
  if i > 20 then e.stress = e.stress + 22 end
  if i > 35 then e.stock = e.stock + 900 end
  if i == 45 then e.stock = nil end
  table.insert(history, e)
end

local size = gfx.size()
local W, H = size.w, size.h
local PLOT_X = 26
local PLOT_W = W - PLOT_X - 6
local GRAPH_H = (H - 12) // #GRAPHS

local function short(n)
  if math.abs(n) >= 10000 then return math.round(n / 1000) .. "K" end
  return tostring(n)
end

local function x_of(i, n)
  return PLOT_X + (POINTS - n + i - 1) * (PLOT_W - 1) // (POINTS - 1)
end

local function draw_graph(g, top)
  local py, ph = top + 14, GRAPH_H - 18
  gfx.rect(1, top, W, GRAPH_H, "black", true)
  local low, high, newest = math.huge, -math.huge, nil
  for _, e in ipairs(history) do
    local v = e[g.key]
    if v then
      low, high, newest = math.min(low, v), math.max(high, v), v
    end
  end
  if g.low then low, high = math.min(low, g.low), math.max(high, g.high) end
  gfx.text(4, top, g.title, "white", 2)
  if newest == nil then
    gfx.text(PLOT_X, py + ph // 2 - 2, "NO DATA YET", "gray")
    return
  end
  if high == low then high = low + 1 end
  local value = short(newest)
  gfx.text(W - 6 - #value * 8 + 2, top, value, g.color, 2)
  gfx.line(PLOT_X - 1, py, PLOT_X - 1, py + ph, "gray")
  gfx.line(PLOT_X - 1, py + ph, PLOT_X + PLOT_W, py + ph, "gray")
  for x = PLOT_X, PLOT_X + PLOT_W, 4 do gfx.pixel(x, py + ph // 2, "gray") end
  gfx.text(2, py, short(high), "light_gray")
  gfx.text(2, py + ph - 5, short(low), "light_gray")
  local px, prev = nil, nil
  for i, e in ipairs(history) do
    local v = e[g.key]
    if v then
      local x = x_of(i, #history)
      local y = py + ph - 1 - math.round((v - low) / (high - low) * (ph - 1))
      if prev then gfx.line(px, prev, x, y, g.color) end
      px, prev = x, y
    else
      prev = nil
    end
  end
  if prev then gfx.pixel(px, prev, "white", 3) end
end

local function ago(seconds)
  if seconds >= 60 then return (seconds // 60) .. "M" end
  return seconds .. "S"
end

local function draw()
  for i, g in ipairs(GRAPHS) do draw_graph(g, (i - 1) * GRAPH_H + 2) end
  gfx.rect(1, H - 8, W, 8, "black", true)
  for k = 0, POINTS - 1, 15 do
    local label = "NOW"
    if k > 0 then label = "-" .. ago(k * PERIOD) end
    local x = x_of(POINTS - k, POINTS)
    gfx.text(math.min(x - #label * 2, W - #label * 4), H - 6, label, "gray")
  end
  if problem then
    gfx.rect(1, H - 8, W, 8, "black", true)
    gfx.text(W // 2 - #problem * 2, H - 6, problem, "red")
  end
end

gfx.clear("black")
draw()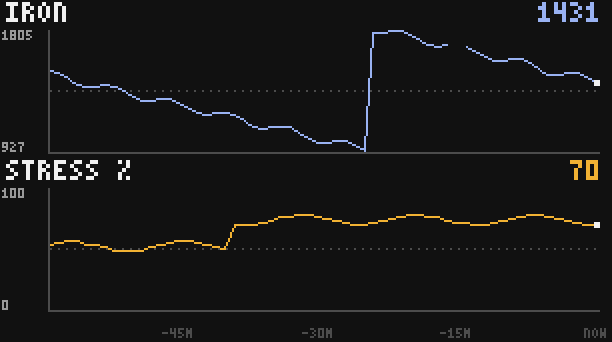
Testing it
- Set
PERIOD = 2for the test: a record every two seconds fills the graphs quickly, and the axis reads "-30S", "-1M"... Put it back to 60 afterwards. Run it, then stop it with Ctrl+T after a few records and look at the file:
> cat /logs/factory.csv
time,stock,stress
18:02,1462,58
18:04,1462,58
18:07,1440,61
(Two real seconds are 40 ticks, about two and a half minutes of world time.)
- Run it again: the curves come back at once, read from the file.
- Take items out of the vault: the iron curve drops at the next record. Break the vault: the next records have an empty field, the curve breaks, and it starts again when the vault is back.
- Rotation. Set
MAX_BYTES = 200and let it run: when the log passes 200 bytes, it becomesfactory.old.csvand a new log starts with its header.ls /logslists both files.
Variations
- Other values. Anything a peripheral reads can be logged: the level of a tank (
@tank.tanks,amountovercapacity), the carts counted by an Inductive Loop Detector (@inductive_loop.count), the altitude of an airship (@altitude_sensor.height). Add a field to the record, a column to the header, a graph toGRAPHS. - Minimum, maximum, average. Walk
historyand write the three numbers under the title: the average of the last hour says more than the last value about a line that runs in bursts. - A day counter.
os.day_timegoes back to a small number at each new morning: remember the previous value, and when the new one is smaller, add one to a day counter saved in a file. Records then readday 12, 18:30. - A central logger. Send each record with
net.sendto a computer in the control room that logs every factory of the base;Remote control over the networkshows how to make sure each message arrives. - On the dashboard. The
Factory dashboardcan show these graphs on a second page.